# ライブラリのインストール
import requests
import json
from datetime import datetime
import time
import pandas as pd
# 価格データを取得する
import requests
In [ ]:
period = '3600' #60*60 1時間足
exchange = 'binance'
pair = 'sandusdt'
# 取得開始日時をtimestampで作る
after = str(int(datetime.timestamp(datetime.strptime('2021-10-15','%Y-%m-%d'))))
url = 'https://api.cryptowat.ch/markets/'
que = f"{url}{exchange}/{pair}/ohlc?periods={period}&after={after}"
que
Out[ ]:
# リクエストする文字列の合成結果を確認
'https://api.cryptowat.ch/markets/binance/sandusdt/ohlc?periods=3600&after=1634223600'
In [ ]:
r = requests.get(que)#取れたデータをjsonに変換する
r2=json.loads(r.text)# 更にテキストに変換
#r2
In [ ]:
cw_data=r2['result'][period]
cw_data[:2]
Out[ ]:
[[1634223600, 0.7521, 0.7974, 0.7518, 0.7765, 4856277, 3786487.4044],
 [1634227200, 0.7762, 0.7807, 0.7604, 0.7776, 1780635, 1371828.337]]
In [ ]:
# DataFrameに突っ込む各列のデータを切り出す
bitcoindate=[] #日付(timestamp)
open=[]
high=[]
low=[]
close=[]
volume = []
In [ ]:
for i in cw_data:
    date=int(i[0])
    lct =datetime.utcfromtimestamp(date)# UTC(Unix標準時)に変換
    bitcoindate.append(lct)
    open.append(i[1])
    high.append(i[2])
    low.append(i[3])
    close.append(i[4])
    volume.append(i[5])
# DataFrameの作成
df=pd.DataFrame({"date":bitcoindate, "open":open, "high":high, "low":low, "close":close, 'volume':volume})

df['date'] = pd.to_datetime(df['date'])#dataをdatetimeに変換して置き換え
print(df['date'].dtype)
df.set_index('date', inplace=True)# indexをdateに設定

df
Out[ ]:
| open | high | low | close | volume | |
|---|---|---|---|---|---|
| date | |||||
| 2021-10-14 15:00:00 | 0.7521 | 0.7974 | 0.7518 | 0.7765 | 4856277.0 |
| 2021-10-14 16:00:00 | 0.7762 | 0.7807 | 0.7604 | 0.7776 | 1780635.0 |
| 2021-10-14 17:00:00 | 0.7770 | 0.7790 | 0.7622 | 0.7685 | 1136074.0 |
| 2021-10-14 18:00:00 | 0.7684 | 0.7780 | 0.7648 | 0.7726 | 1131613.0 |
| 2021-10-14 19:00:00 | 0.7714 | 0.7743 | 0.7636 | 0.7737 | 508169.0 |
| … | … | … | … | … | … |
| 2021-11-25 00:00:00 | 7.7087 | 7.7427 | 7.3000 | 7.4708 | 10599016.0 |
| 2021-11-25 01:00:00 | 7.4700 | 7.4981 | 6.8535 | 6.8875 | 25090984.0 |
| 2021-11-25 02:00:00 | 6.8874 | 7.4925 | 6.8798 | 7.3852 | 19163103.0 |
| 2021-11-25 03:00:00 | 7.3839 | 7.5282 | 7.1464 | 7.1842 | 10905073.0 |
| 2021-11-25 04:00:00 | 7.1848 | 7.2300 | 7.0800 | 7.1131 | 1161806.0 |
998 rows × 5 columnsIn [ ]:
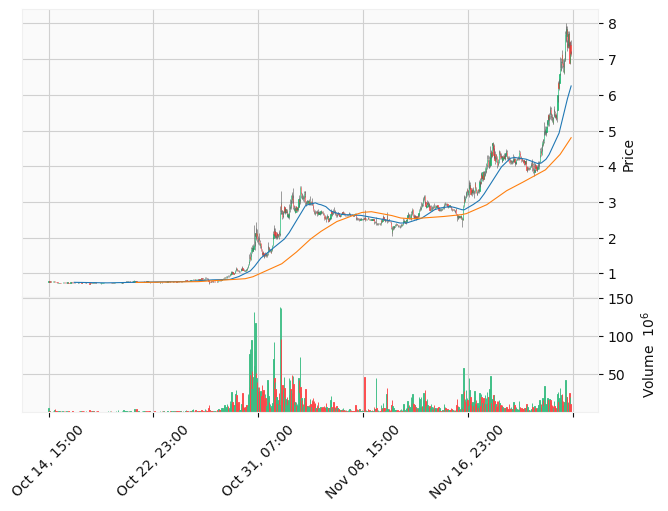
# ローソク足の描画
# 2020年5月 mplfinanceという新たなパッケージが作られている
# https://note.nkmk.me/python-pandas-matplotlib-candlestick-chart/
import mplfinance as mpf
%matplotlib inline
#mpf.plot(df)
mpf.plot(df, type='candle',  volume=True, mav=(50, 168),  style='yahoo')
コメント