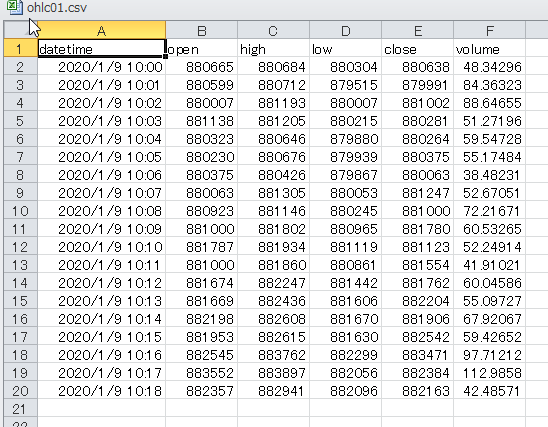
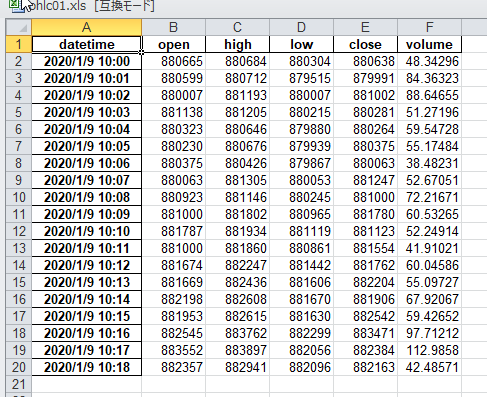
csvファイルを読み込む場合、pandasを使ったほうが、配列に読み込むに比べて随分楽だ。6行t対1行でpandasの勝ちだ
#
#リストに読み込むとき
data=[]
with open(filename,mode='r',newline='')as fp:
    reader=csv.reader(fp)
    for row in reader:
        #print(row)
        data.append(row)

#pandasに読み込む
df_csv = pd.read_csv(filename,index_col=0)
CSVファイルをpandasでDataFrameに読み込んで、
CSVとexcelファイルに書き出す。
#
#-------------------------------------------------------------------------------
# Name:        module1
# Purpose:
#
# Author:      leoco
#
# Created:     29/02/2020
# Copyright:   (c) leoco 2020
# Licence:     <your licence>
#-------------------------------------------------------------------------------
import pandas as pd
import os, tkinter, tkinter.filedialog, tkinter.messagebox
import csv
from os import path


def get_filename():
# ファイル選択ダイアログの表示
    root = tkinter.Tk()
    root.withdraw()
    fTyp = [("",".csv")]#fTyp = [("","*")]すべての種類
    iDir = os.path.abspath(os.path.dirname(__file__))
    file = tkinter.filedialog.askopenfilename(filetypes = fTyp,initialdir = iDir)
    return file

ohlc = pd.read_csv(get_filename(),index_col=0)
    #"C:/github/sample/python/pandas/basic/anko.csv", index_col=0)
print(ohlc)
#----------------------------------------------

# データフレームをCSVファイルに書き込む
ohlc.to_csv(input('output filename?(.csv)')+".csv")

# データフレームをExcelファイルに書き込む
ohlc.to_excel(input('output filename?(.xls)')+".xls")
csvを読み込んで内容を書き出した画面
                  open    high     low   close      volume
datetime
2020/1/9 10:00  880665  880684  880304  880638   48.342958
2020/1/9 10:01  880599  880712  879515  879991   84.363229
2020/1/9 10:02  880007  881193  880007  881002   88.646550
2020/1/9 10:03  881138  881205  880215  880281   51.271963
2020/1/9 10:04  880323  880646  879880  880264   59.547281
2020/1/9 10:05  880230  880676  879939  880375   55.174840
2020/1/9 10:06  880375  880426  879867  880063   38.482309
2020/1/9 10:07  880063  881305  880053  881247   52.670513
2020/1/9 10:08  880923  881146  880245  881000   72.216712
2020/1/9 10:09  881000  881802  880965  881780   60.532654
2020/1/9 10:10  881787  881934  881119  881123   52.249143
2020/1/9 10:11  881000  881860  880861  881554   41.910211
2020/1/9 10:12  881674  882247  881442  881762   60.045865
2020/1/9 10:13  881669  882436  881606  882204   55.097271
2020/1/9 10:14  882198  882608  881670  881906   67.920673
2020/1/9 10:15  881953  882615  881630  882542   59.426518
2020/1/9 10:16  882545  883762  882299  883471   97.712122
2020/1/9 10:17  883552  883897  882056  882384  112.985775
2020/1/9 10:18  882357  882941  882096  882163   42.485714
output filename?(.csv)olhc02
output filename?(.xls)olhc01
書き出したCSV
書き出したエクセル
並び替え、簡単すぎる
#並び替え
#sort 列highで昇順(True)
ohlc2=ohlc.sort_values('high',ascending=True)
print(ohlc2)
結果 high 列が昇順になっている
#
                  open    high     low   close     volume
datetime
2020/1/9 10:00  880665  880684  880304  880638  48.342958
2020/1/9 10:01  880599  880712  879515  879991  84.363229
2020/1/9 10:02  880007  881193  880007  881002  88.646550
2020/1/9 10:03  881138  881205  880215  880281  51.271963
2020/1/9 10:04  880323  880646  879880  880264  59.547281
2020/1/9 10:05  880230  880676  879939  880375  55.174840
2020/1/9 10:06  880375  880426  879867  880063  38.482309
2020/1/9 10:07  880063  881305  880053  881247  52.670513
2020/1/9 10:08  880923  881146  880245  881000  72.216712
                  open    high     low   close     volume
datetime
2020/1/9 10:06  880375  880426  879867  880063  38.482309
2020/1/9 10:04  880323  880646  879880  880264  59.547281
2020/1/9 10:05  880230  880676  879939  880375  55.174840
2020/1/9 10:00  880665  880684  880304  880638  48.342958
2020/1/9 10:01  880599  880712  879515  879991  84.363229
2020/1/9 10:08  880923  881146  880245  881000  72.216712
2020/1/9 10:02  880007  881193  880007  881002  88.646550
2020/1/9 10:03  881138  881205  880215  880281  51.271963
2020/1/9 10:07  880063  881305  880053  881247  52.670513
行ラベル列ラベルの取り出し
#
print(ohlc.columns)#列ラベル
print(ohlc.index)#インデックス(行ラベル)
#出力
Index(['open', 'high', 'low', 'close', 'volume'], dtype='object')
Index(['2020/1/9 10:00', '2020/1/9 10:01', '2020/1/9 10:02', '2020/1/9 10:03',
       '2020/1/9 10:04', '2020/1/9 10:05', '2020/1/9 10:06', '2020/1/9 10:07',
       '2020/1/9 10:08'],
データ型
#
print(ohlc.dtypes)#データ型
#出力
open        int64
high        int64
low         int64
close       int64
volume    float64
dtype: object
基本統計自動出力
#
print(ohlc['open'].describe())#基本統計
print(ohlc['volume'].describe())#基本統計
#出力
count         9.000000
mean     880480.333333(平均)
std         382.980091(標準偏差)
min      880007.000000(最小値)
25%      880230.000000(25%の位置)
50%      880375.000000(50)
75%      880665.000000(75)
max      881138.000000(最大値)
Name: open, dtype: float64
count     9.000000
mean     61.190706
std      16.966749
min      38.482309
25%      51.271963
50%      55.174840
75%      72.216712
max      88.646550
Name: volume, dtype: float64


コメント